
Real Time Energy Data Monitoring
Technologies


Overview
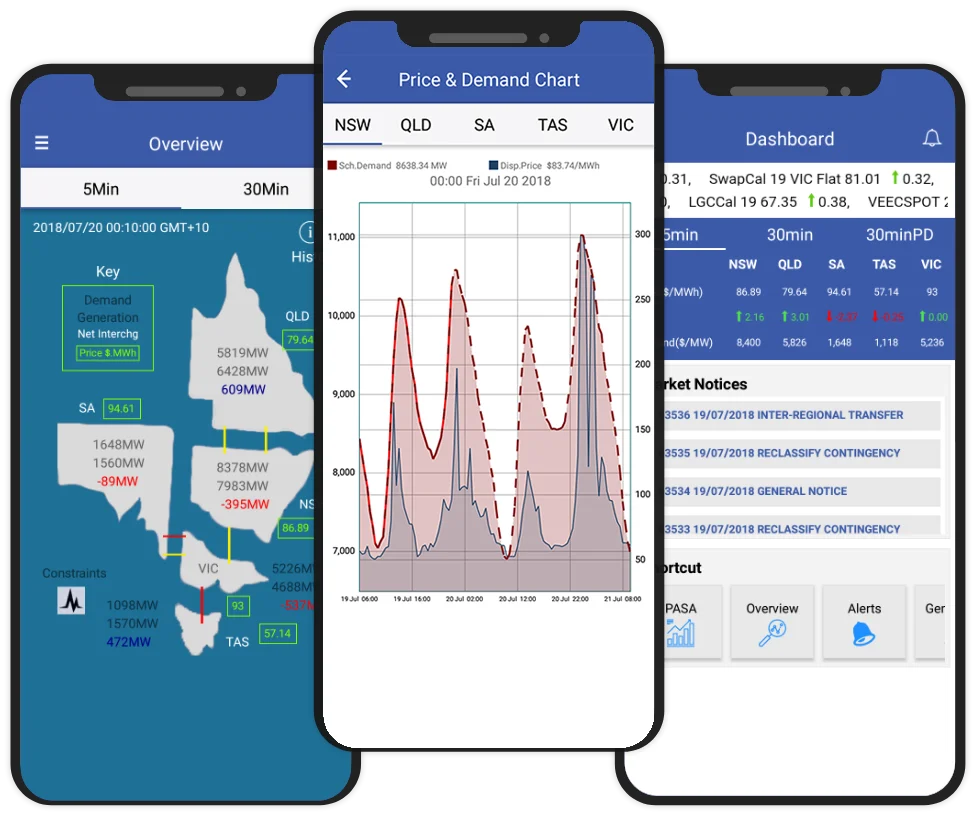
This mobile application which is specially designed and developed for energy traders to monitor real-time Australian National Electricity Market (NEM) information. This application displays the latest National Electricity Market information like traded and pre-dispatch electricity price, demand, generation, interconnector flows, etc. in an easy to view graphical screen. This application helps High Voltage Broker customers or anyone who works within the Australian Electricity/Energy industry to understand the electricity market demands and prices easily.
Project Scope
The client wanted us to redesign the entire application from scratch with new functionalities and in the latest version for both Android and iOS. The client mainly wanted to improve the UI of the whole application to deliver a completely new interface that enables users to get proper information with an excellent browsing experience.
The client also wanted to perform real-time predictive analytics that triggers alerts and notifies app users about the latest Australian Electricity Market information so that they can make decisions accordingly.
Challenges
- The performance was a major challenge while working on a complex system that is using multiple websites to manage the data.
- The system has different types of users, so it was quite a concern to manage them all considering the security matrix and allow them to access information as per their roles and responsibilities.
Solutions
As per client’s expectations, we’ve redesigned and redeveloped the application from scratch using the latest React Native version for both Android and iOS with their native components. The complete application is redeveloped in a manner to process large data into easy to understand format and provide critical Australian Electricity market insights
To improve the look and feel of the application, we’ve decided to go with simple yet appealing UI which helps users to easily navigate and monitor real-time Australian Electricity market information. Also, to allow easy monitoring of data, we’ve used different types of line and area filled charts which show electricity generation, price, and demand in different locations.
For better user experience, we’ve
- Integrated chat feature which enables users to chat with app admin.
- Added custom sound features for alerts which also enable users to record their sounds and use them to push notification messages.
- Represented demand generation, Net interchange, and price on a static Australian map by using a set of arrows which are managed programmatically.
Want to know more about the above project or have some awesome project ideas in mind? If so, then please fill out the form below, our team will get back to you as soon as possible. You can also send us an email at info@5exceptions.com with your detailed project requirement.